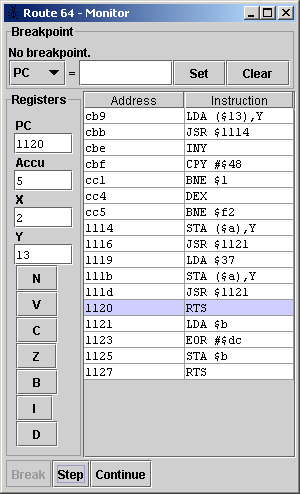
 . The window below opens.
Route 64 comes with a simple built-in debugger, called in the old times
also frequently Monitor. To open the debugger use either the menu item
[Tools/Debugger...] or the toolbar icon  . The window below opens.

Opening the debugger window does not impact the emulation. To enter single step mode, execution has to be interrupted by setting a breakpoint or by just performing a break at the current program counter position.
At the top of the window is the Breakpoint configuration section. A breakpoint stops the CPU if the contents of one of the registers is equal to a certain value. To set the breakpoint select the register, enter the break value and set the breakpoint by pressing the [Set] button. This displays the breakpoint in the user interface.
The most common use is to set a breakpoint on the program counter (PC), allowing to stop the CPU at the specified code position.
To remove an existing breakpoint, press the [Clear] button.
At the left of the window is the register monitor. This displays the values of the registers and the status flags while in single-step mode. Register contents is displayed in hexadecimal notation. For a decimal displaymove the mouse pointer to the register contents in question and wait until a tooltip shows up displaying decimal notation.
Accu -- Contents of the accumulator register.
X -- Contents of the X register.
Y -- Contents of the Y register.
N -- Negative flag.
V -- Overflow flag.
C -- Carry flag.
Z -- Zero flag.
B -- Break flag.
I -- Interupt flag.
D -- Decimal flag.
Button Break -- Break execution at the current Program Counter (PC) position.
Button Step -- Perform a single step.
Button Continue -- continue execution until a breakpoint is hit or the [Break] button is pressed again.
| Last modified: 2004/05/23 | Comments | Copyright © 2006 Michael G. Binz |