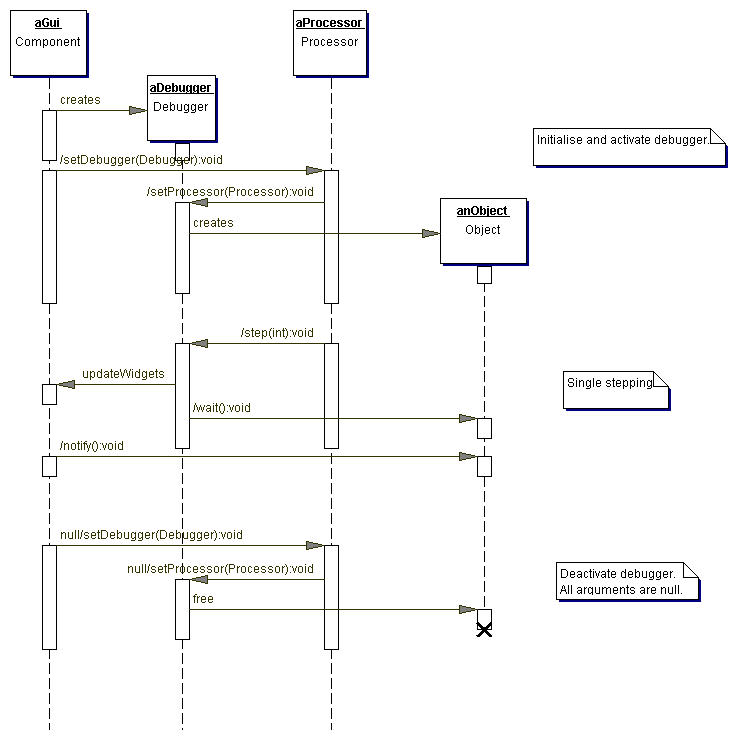
A special interface exists that allows for the integration of a debugger system. The current system relies on an implementation of the Processor interface that is able to accept an inplementation of the Debugger interface. A reference to the emulation's processor is available from the C64Core object. The dynamic behavior of these interfaces is displayed in the following sequence diagram:

There exist three basic scenarios when integrating a debugger. Activation means what steps need to be taken to add a debugger implementation to the running system. Single stepping means how the system behaves when a debugger instance has been added to the system. This should cover all possible interactions needed for single stepping, the handling of breakpoints, and other things that a Debugger plans to undertake. Removing the debugger from the system is meant with deactivation.
The first scenario – adding a debugger – is quite easy to implement. After creating an instance of the debugger it has to be registered with the Processor via the setDebugger() operation. This leads to a backward call onto the Debugger's setProcessor() call. Note that the type of the object that is passed via this call into the Debugger is the real Processor implementation which is a reference to the fully specialized CPU object. It is recommended that the debugger defines an object used for thread locking that is used in the later stages for being able to control the CPU thread from the user interface without busy waiting.
| Last modified: 2005/07/21 | Comments | Copyright © 2006 Michael G. Binz |